Initial Setup
Creating a Super Admin
The first step in setting up the Edge Service is to create a super admin account. This can be done via an API call to the initialization endpoint:- Start the Edge Service with:
- Use a REST client (like Postman or cURL) to make a POST request to the initialization endpoint:
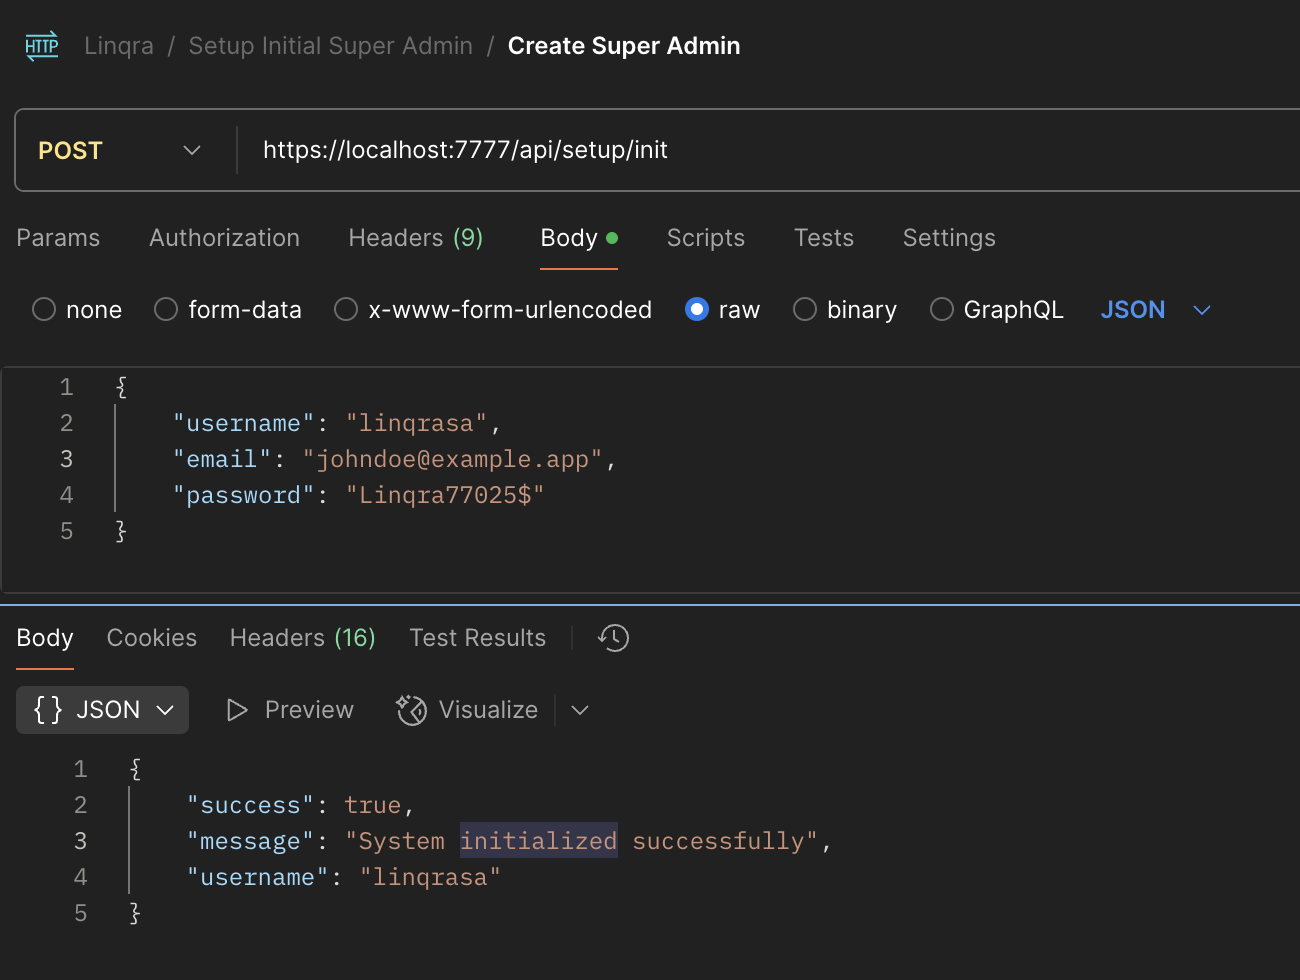
- Upon successful initialization, you’ll receive a response confirming the system has been initialized with your super admin account:
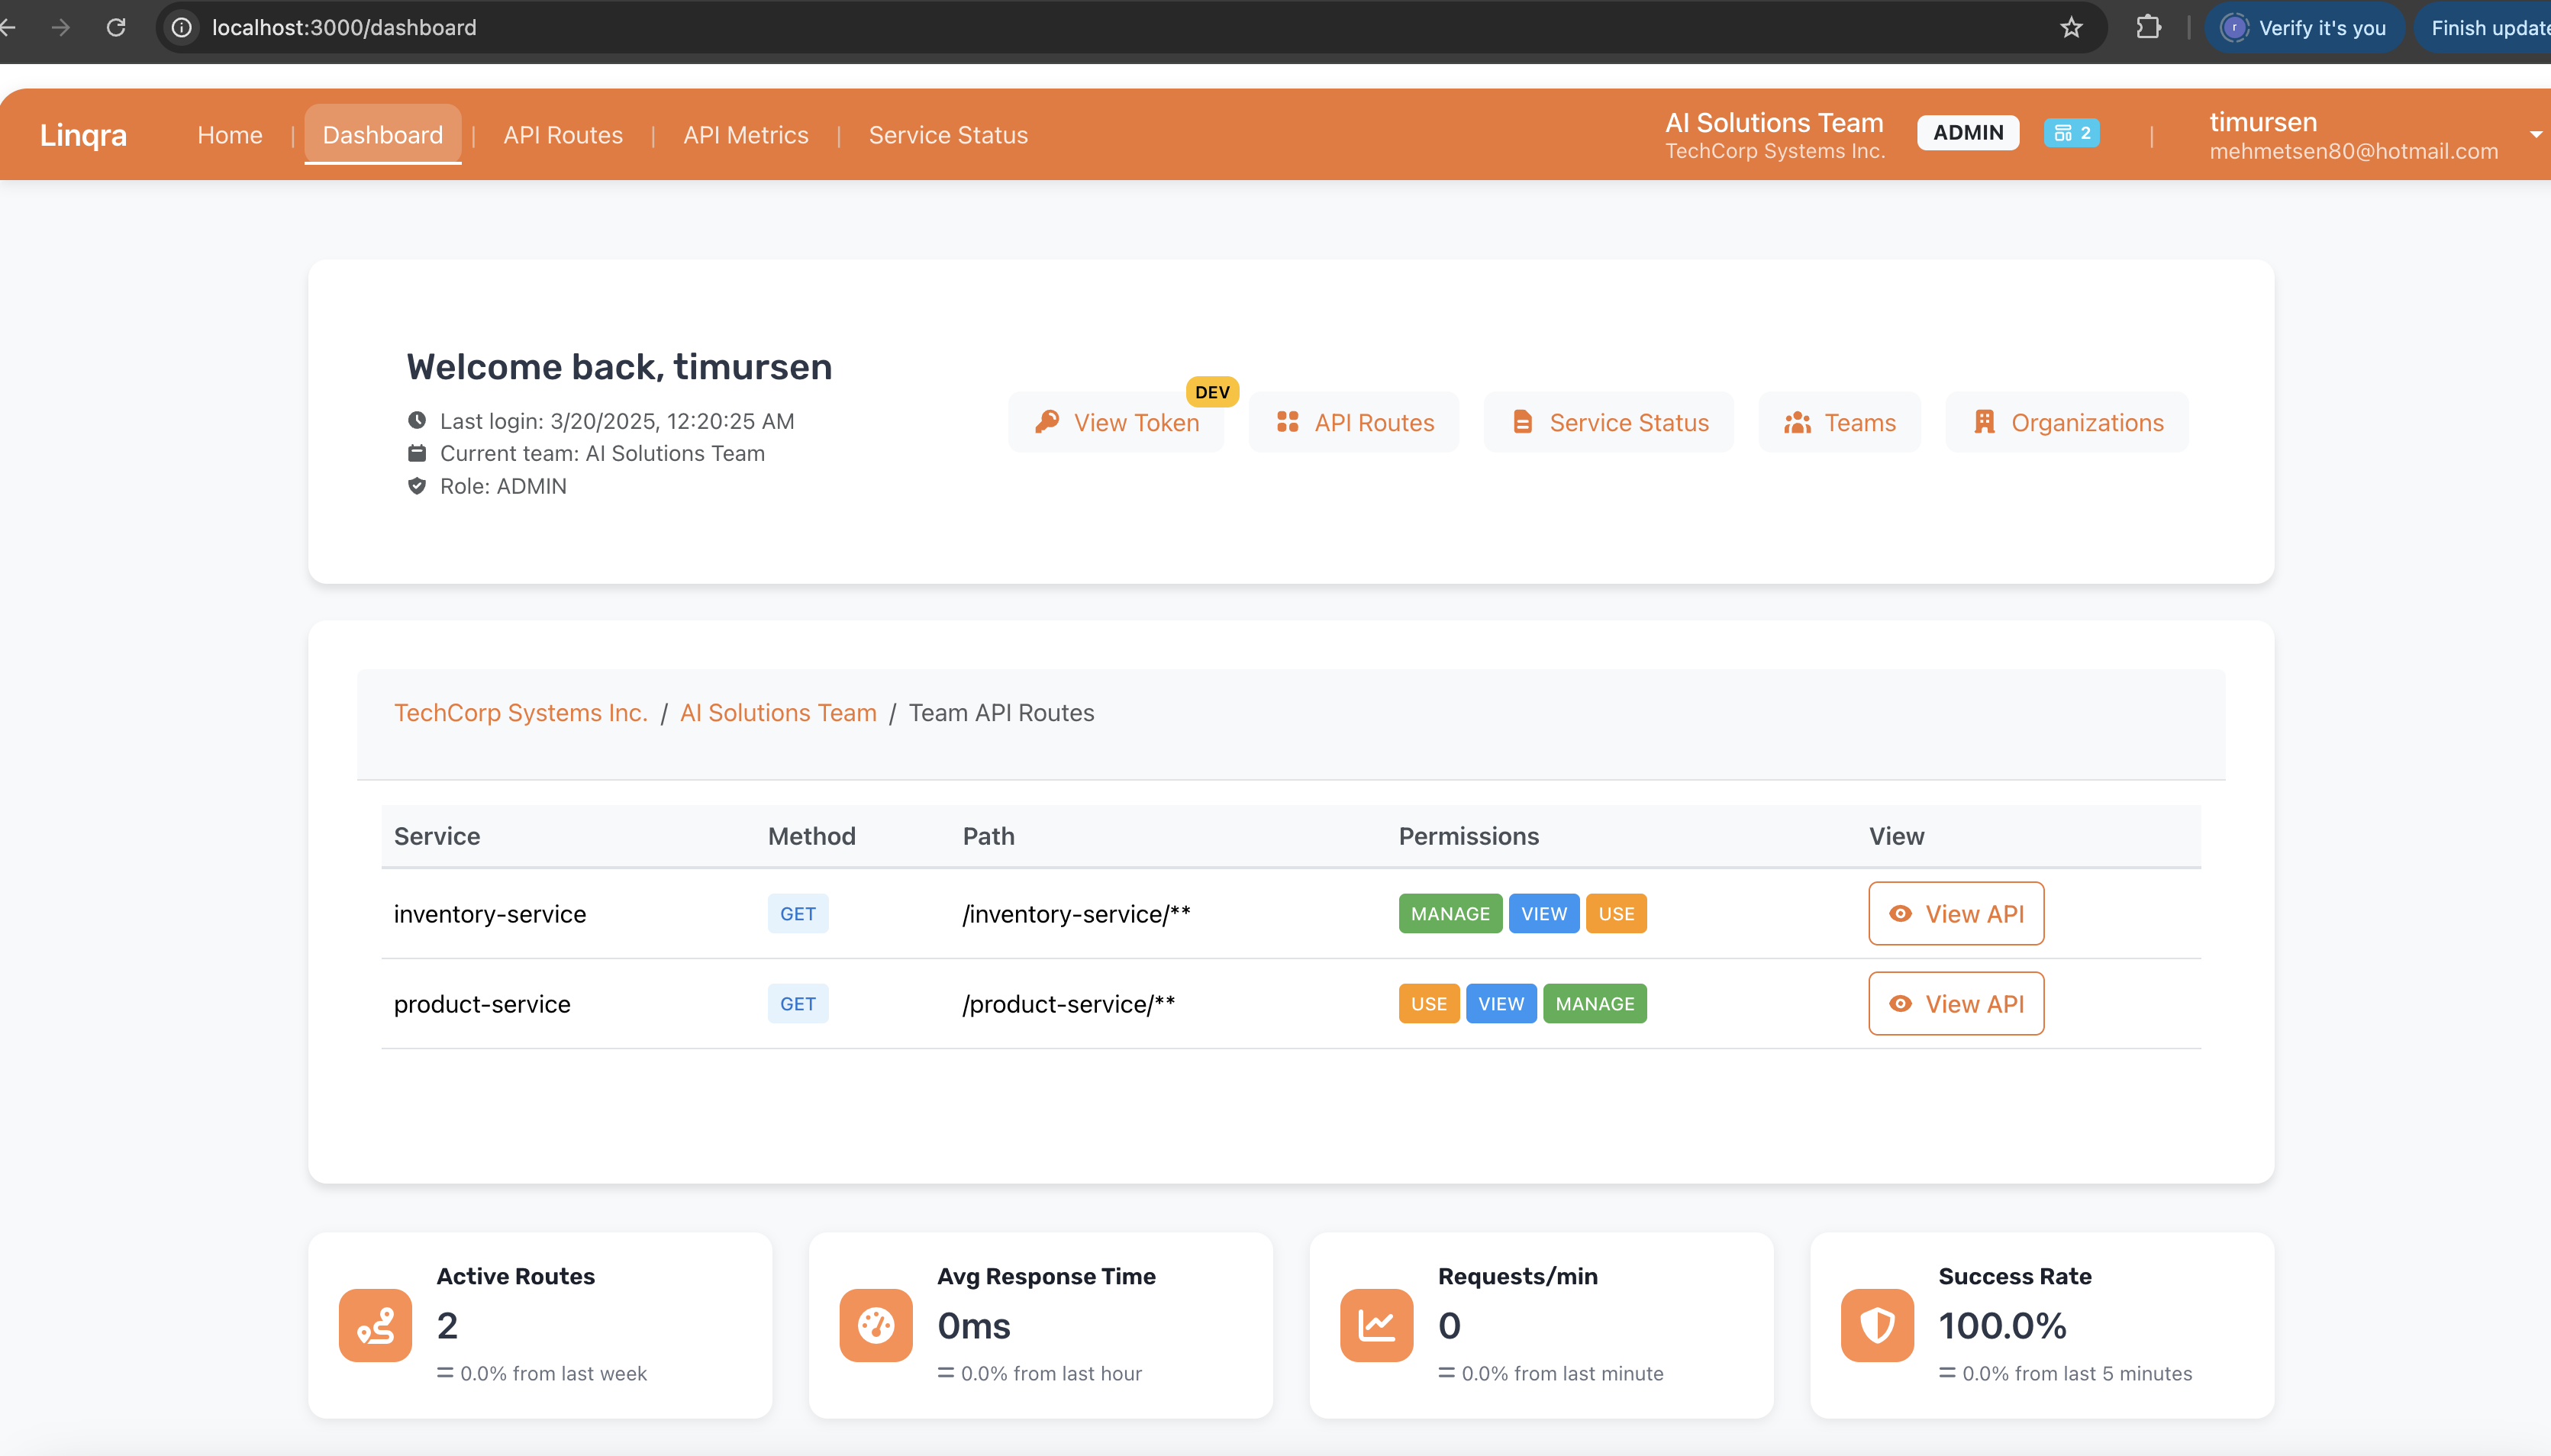
Accessing the Admin Interface
After creating the super admin account, you can access the Edge Service admin interface:- Navigate to
https://localhost:3000in your browser - Log in with the username and password you created in the previous step
Organization and Team Management
Before configuring API routes, you should set up your organizational structure:- Navigate to the Organizations section in the sidebar
- Click Create Organization and fill in the required details
- Once your organization is created, go to the Teams section
- Click Create Team to create teams within your organization
- Assign appropriate permissions and members to each team
API Route Configuration
After setting up your organizational structure, you can begin creating API routes for your microservices.Creating an API Route
- Navigate to the API Routes section in the admin interface
- Click Create New API Route
-
Fill in the following details:
- Select Team: Choose the team that will own this route (e.g., “AI Solutions Team”)
- Route Identifier: A unique identifier for the route (e.g., “inventory-service”)
- Path: The path pattern to match for this route (e.g., “/inventory-service/**”)
- URI: The target service URI where requests will be forwarded (e.g., “lb://inventory-service”)
- Scope: Define the access scope for this route (e.g., “inventory-service.read”)
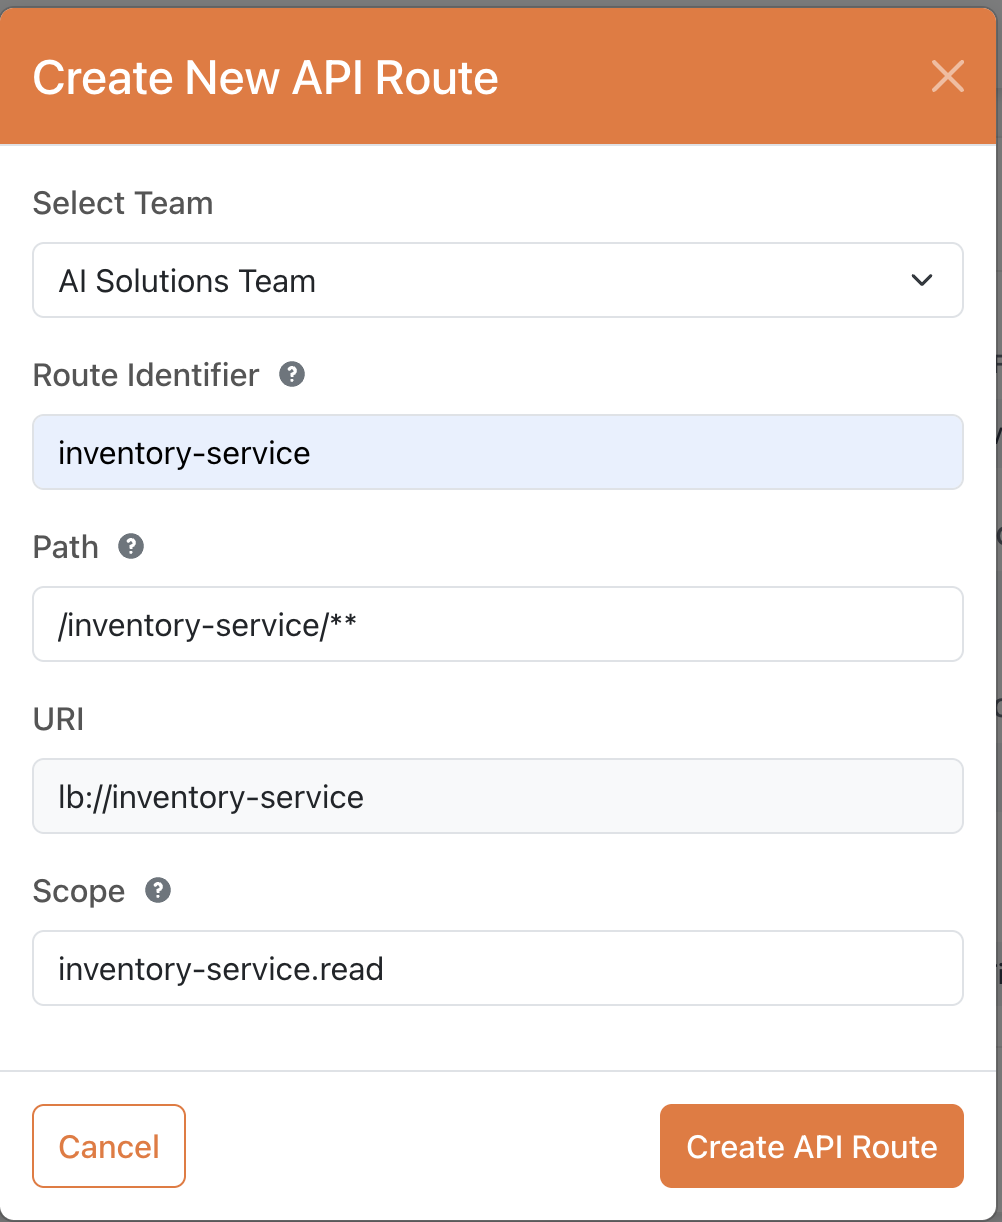
- Click Create API Route to save your configuration
Understanding Route Configuration Fields
- Team: Associates the route with a specific team for governance and access control
- Route Identifier: A unique name used internally to identify the route
- Path: The URL path pattern that will trigger this route (supports wildcards)
- URI: The destination service address
- Use
lb://service-nameformat for load-balanced services registered with Eureka - Use direct URLs like
https://internal-service:8080for services not registered with Eureka
- Use
- Scope: OAuth 2.0 scopes required to access this route
Advanced Route Configuration
Each API route can be further customized with:- Rate Limiting: Control how many requests can be made within a time period
- Circuit Breaking: Define failover behavior when a service is unresponsive
- Request Transformation: Modify requests before they reach the target service
- Response Transformation: Modify responses before they are returned to the client
- Security Policies: Apply authentication and authorization requirements
Connecting Microservices
For a microservice to be accessible through the Edge Service:- Ensure the microservice is registered with Eureka (if using service discovery)
- Create an API route pointing to the microservice
- Configure the microservice to accept requests from the Edge Service
- Set up appropriate security between the Edge Service and the microservice
Monitoring and Observability
The Edge Service provides comprehensive monitoring capabilities:- Request Metrics: View throughput, latency, and error rates for each route
- Service Health: Monitor the status of connected microservices
- Audit Logs: Track administrative actions and security events
- Usage Analytics: Analyze API usage patterns by team, route, or client
Viewing Service Metrics
To view service metrics:- Navigate to the Monitoring section in the admin interface
- Select the time period you wish to analyze
- Filter by service, route, or team to narrow down the results
- Export reports in various formats for further analysis
Security Considerations
When configuring the Edge Service, keep these security best practices in mind:- Use strong passwords for admin accounts
- Implement the principle of least privilege for team permissions
- Regularly rotate API keys and credentials
- Enable TLS for all service-to-service communication
- Configure appropriate CORS policies for browser-based clients
- Implement IP-based access controls where appropriate
JWT Token Configuration
The Edge Service can be configured to validate JWT tokens issued by Keycloak:Troubleshooting
Common Issues
- Service Not Found: Verify the service is registered with Eureka and the service name matches the lb:// URI
- Authorization Failure: Check that the required scopes are correctly set and the user has the necessary permissions
- Invalid Routes: Ensure the path patterns don’t conflict with other routes
- Performance Issues: Monitor rate limiting and circuit breaking configurations
Logs and Diagnostics
The Edge Service logs can be found at:Next Steps
After configuring the Edge Service, consider:- Setting up a production-ready deployment with high availability
- Implementing a CI/CD pipeline for route configuration
- Integrating with external monitoring and alerting systems
- Developing custom filters and predicates for specialized routing needs